gftool.lattice.box.gf_z
- gftool.lattice.box.gf_z(z, half_bandwidth)[source]
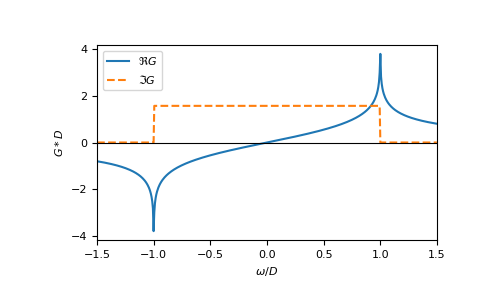
Local Green’s function corresponding to a box DOS.
\[G(z) = \ln(\frac{z + D}{z - D}) / 2D\]- Parameters:
- zcomplex array_like or complex
Green’s function is evaluated at complex frequency z.
- half_bandwidthfloat
Half-bandwidth of the box DOS.
- Returns:
- complex np.ndarray or complex
Value of the Green’s function corresponding to a box DOS.
Examples
>>> ww = np.linspace(-1.5, 1.5, num=500)
>>> gf_ww = gt.lattice.box.gf_z(ww, half_bandwidth=1)
>>> import matplotlib.pyplot as plt
>>> _ = plt.plot(ww, gf_ww.real, label=r"$\Re G$")
>>> _ = plt.plot(ww, gf_ww.imag, '--', label=r"$\Im G$")
>>> _ = plt.xlabel(r"$\omega/D$")
>>> _ = plt.ylabel(r"$G*D$")
>>> _ = plt.axhline(0, color='black', linewidth=0.8)
>>> _ = plt.xlim(left=ww.min(), right=ww.max())
>>> _ = plt.legend()
>>> plt.show()
