gftool.lattice.box.gf_ret_t
- gftool.lattice.box.gf_ret_t(tt, half_bandwidth, center=0)[source]
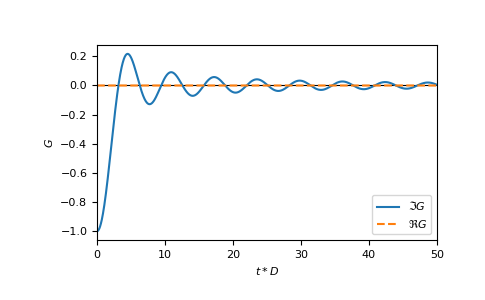
Local retarded-time local Green’s function corresponding to a box DOS.
\[G(t) = -1j Θ(t) \sin(Dt)/Dt\]where \(D\) is the half bandwidth.
- Parameters:
- ttfloat array_like or float
Green’s function is evaluated at time tt.
- half_bandwidthfloat
Half-bandwidth of the box DOS.
- centerfloat
Position of the center of the box DOS. This parameter is not given in units of half_bandwidth.
- Returns:
- complex np.ndarray or complex
Value of the retarded-time Green’s function corresponding to a box DOS.
Examples
>>> tt = np.linspace(0, 50, 1500)
>>> gf_tt = gt.lattice.box.gf_ret_t(tt, half_bandwidth=1)
>>> import matplotlib.pyplot as plt
>>> _ = plt.axhline(0, color='black', linewidth=0.8)
>>> _ = plt.plot(tt, gf_tt.imag, label=r"$\Im G$")
>>> _ = plt.plot(tt, gf_tt.real, '--', label=r"$\Re G$")
>>> _ = plt.xlabel(r"$t*D$")
>>> _ = plt.ylabel(r"$G$")
>>> _ = plt.xlim(left=tt.min(), right=tt.max())
>>> _ = plt.legend()
>>> plt.show()
